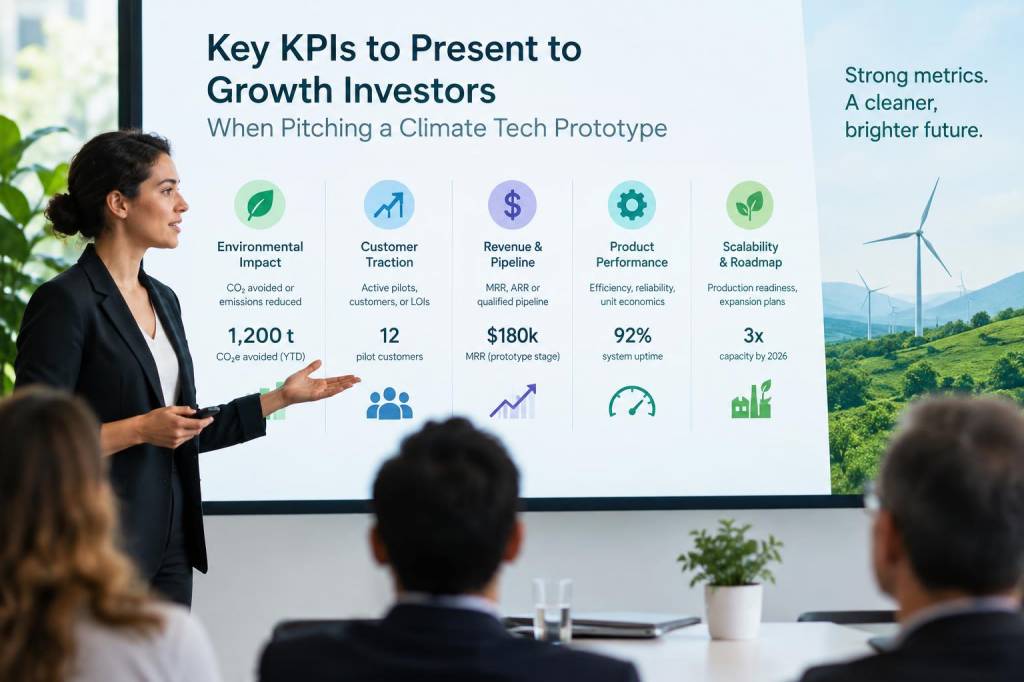
When I'm pitching a climate tech prototype to growth-stage investors, I focus less on the glossy vision and more on the measurable signals that prove the idea can scale, capture market share, and generate returns—while actually delivering climate impact. Investors want to understand both the environmental thesis and the financial mechanics. Below I share the KPIs I always bring to the table, how I display them, and why each one matters for a growth investor evaluating a prototype.
Why choosing the right KPIs matters
I've learned the hard way that drowning an investor in data is as bad as giving them none. The right KPIs tell a concise story: technical feasibility, early-market traction, unit economics, capital efficiency, and climate impact. For a climate tech prototype, you must prove the technology works, customers want it, and margins + capital needs align with growth expectations. The KPIs below are what I use to convince growth investors that our prototype has a repeatable, scalable business model.
Core KPI categories I present
I group metrics into five categories so investors can quickly find the signal they care about:
Technical & development milestonesMarket & traction metricsUnit economics & financial healthCapital & runway metricsClimate impact metricsTechnical & development KPIs
For a prototype, technical credibility is foundational. I highlight:
Technology Readiness Level (TRL) — Where the prototype sits (TRL 4–7 is common for demonstrators). I show what needs to be done to hit TRL 8–9 and estimated time/cost.Prototype performance vs spec — Key engineering metrics (efficiency, throughput, lifespan, error rates). I show target vs achieved and confidence intervals.Reliability / uptime — Mean Time Between Failures (MTBF) or uptime percentage during pilot runs.Scaling factor — How performance changes when scaling from lab to pilot (e.g., heat exchanger efficiency at 1x vs 10x).IP status — Patents filed/granted and freedom-to-operate assessments.Investors want to see a clear, realistic roadmap from prototype to commercial product. I always attach a timeline with milestones and costs.
Market & traction KPIs
Even when the tech isn't fully mature, early-market signals are powerful:
Pilot customers / LOIs — Number and profile of pilot partners, length of pilots, and any letters of intent (LOIs) or paid pilots.Conversion rates — From demo to pilot, pilot to paid deployment. These conversion metrics tell investors whether the sales process is repeatable.Addressable market estimates (TAM/SAM/SOM) — Show realistic serviceable obtainable market and the assumptions behind it.Pipeline value & velocity — Total value of active opportunities, average deal size, and sales cycle length.Customer feedback / NPS — Qualitative validation: quotes, NPS scores, reduction in client pain points.Unit economics & financial KPIs
This is where growth investors assess scalability. I present unit economics at the unit level (per device, per site, per MWh, etc.) and for scaled volumes:
Cost per unit (BoM) — Bill of materials and expected manufacturing cost at scale, including learning curve assumptions.Gross margin (%) — At pilot, at 1k units, at 10k units.Lifetime Value (LTV) — Average contract value over customer lifespan (for hardware + services models include recurring revenue streams).Customer Acquisition Cost (CAC) — Sales and marketing spend to acquire a customer or deployment.LTV/CAC ratio — A simple sanity check for unit economics; I aim to show how this improves with scale.Payback period — Months to recoup acquisition cost or manufacturing cost through cash flows.Capital & runway KPIs
Growth investors want to know how much capital is needed and when.
Burn rate (monthly) — Current and projected burn, segmented by R&D, manufacturing, and commercial.Runway (months) — Based on current burn and expected milestones.Use of proceeds — Clear allocation: prototype completion, certification, first manufacturing run, commercial hires.Next financing trigger & expected valuation uplift — What milestone will unlock the next, larger round and the implied value uplift.Unit capital intensity (CapEx per deployment) — For hardware-heavy models, show capital required to produce and install each unit.Climate impact KPIs
This is non-negotiable for climate tech. Investors expect quantifiable environmental results:
CO2e avoided / reduced — Measured per unit/year and across projected deployments.Energy saved / efficiency gains — kWh saved per unit, % improvement vs baseline.Lifecycle emissions — Embedded emissions from manufacturing vs emissions avoided over life.Additional environmental co-benefits — Water saved, waste reduced, biodiversity benefits if relevant.Certification & verification plans — How impact will be measured and verified (third-party auditors, ISO standards, certs).How I present these KPIs — format matters
Numbers are persuasive when paired with clarity. I use a mix of visuals and tables to make it digestible:
One-slide KPI dashboard — A single slide with 8–10 top KPIs (one from each category) so investors can glance and understand the story.Roadmap table — Milestone, timeline, cost, expected KPI lift (e.g., "Reduce BoM by 30% after pilot manufacturing run").Scenario tables — Conservative / base / optimistic scenarios for unit economics and emissions impact.Pilot case study — One page detailing a pilot customer, results, issues found, and improvements implemented.| KPI | Why it matters | How I present it |
|---|
| TRL | Shows technical maturity | Timeline + cost to reach next TRL |
| Conversion rates (demo→pilot→paid) | Indicates commercial repeatability | Funnel diagram with % at each stage |
| Gross margin | Shows long-term profitability | Margins by volume band (1k, 10k) |
| LTV / CAC | Indicates payback and unit economics | Ratio + payback months |
| CO2e avoided per year | Quantifies environmental impact | Per-unit and cumulative projections |
Benchmarks and credibility
Whenever possible, I benchmark our KPIs against industry comparables—whether it's Levelized Cost of Energy (LCOE) for energy projects, cost per ton of CO2 avoided, or typical sales cycle lengths in the sector. If public comparables are scarce, I show assumptions transparently and provide sensitivity analyses. Growth investors respect rigor and caution more than optimistic guesses.
Common investor questions I preempt
These are questions I proactively answer in the pitch materials:
What are the biggest technical risks and mitigation plans?How will unit cost fall with scale (learning rate)?What is the expected timeline to achieve positive gross margin?What regulatory or permitting risks exist?How will you measure and certify claimed emissions reductions?Addressing these with concrete KPIs and documented plans reduces friction in investor diligence.
A final practical tip
When I present KPIs to growth investors, I always anchor them in stories—one pilot narrative, one customer quote, and one chart that makes the financial case jump off the page. Numbers plus narrative build credibility and make it easier for investors to picture the path from prototype to profitable, impactful scale.